Improving Core Web Vitals: A Practical Guide
LCP, INP, and CLS explained clearly — with concrete actions that deliver measurable results right away. Includes a prioritized order of implementation.

Paul Mill
Web Design & Development

Table of contents
Pages ranking in position 1 on Google pass Core Web Vitals thresholds 10% more often than pages in position 9. That sounds small — until you consider that the difference between position 3 and position 8 can mean the difference between 200 and 20 leads per month for a small business.
Core Web Vitals are Google’s metrics for real-world user experience. Since the Core Update in March 2026, Google has been weighting performance signals more heavily than before. This guide covers the three metrics, their thresholds, and — most importantly — the actions with the highest impact.
The Three Metrics at a Glance
Core Web Vitals measure three aspects of user experience: loading speed (LCP), responsiveness (INP), and visual stability (CLS).
| Metric | What it measures | Good | Poor |
|---|---|---|---|
| LCP — Largest Contentful Paint | How quickly the largest visible content appears | ≤ 2.5 s | > 4.0 s |
| INP — Interaction to Next Paint | How quickly the page responds to clicks/taps | ≤ 200 ms | > 500 ms |
| CLS — Cumulative Layout Shift | How stable the layout remains while loading | ≤ 0.1 | > 0.25 |
Important: Google measures field data — real user experiences via the Chrome UX Report, not lab tests. Lighthouse scores are useful for debugging, but field data is what determines your ranking.
First: Do You Have Field Data at All?
The question sounds trivial, but it decides whether the rest of this guide is measurable for you. The Chrome UX Report only reports a site once enough visitors come together who use Chrome and have opted in to sending usage statistics. Google does not publish where exactly that threshold sits — in practice, a large share of small business websites falls below it.
You will spot it immediately: if PageSpeed Insights says at the top that there is not enough data for an assessment, there is no field data for that URL. Sometimes values still appear for the origin — the domain as a whole, averaged across all pages. Better than nothing, but it will not tell you which page has the problem.
Three consequences follow:
Without field data, the Lighthouse score is your only number — and it is a simulation. Lighthouse loads the page once, on an artificially throttled connection, with nobody clicking. It cannot measure INP at all and shows Total Blocking Time as a proxy instead. As a diagnostic it is excellent. As a target it is not.
Your own measurements take an afternoon to set up. Google’s web-vitals library measures in the browsers of real visitors and sends the result to an endpoint of your own:
import { onLCP, onINP, onCLS } from "web-vitals";

function send(metric) {
  navigator.sendBeacon("/api/vitals", JSON.stringify({
    name: metric.name,        // "LCP" | "INP" | "CLS"
    value: metric.value,
    rating: metric.rating,    // "good" | "needs-improvement" | "poor"
    path: location.pathname,
  }));
}

onLCP(send);
onINP(send);
onCLS(send);
That gives you your own numbers within days instead of weeks — and per page instead of per domain. One note that such guides usually leave out: measuring this way means processing usage data. It belongs in your privacy policy, and you should not collect anything that ties a measurement to an individual in the first place.
Until then: optimize the causes, not the number. Everything below works whether or not anyone can read it off in the Chrome UX Report.
The Right Order: TTFB → LCP → INP → CLS
Before optimizing individual metrics: work in this order. TTFB (Time to First Byte) is the foundation — if the server responds slowly, no other optimization can compensate for it.
| Priority | Metric | Typical Lever |
|---|---|---|
| 1 | TTFB | Enable CDN, server-side caching |
| 2 | LCP | Optimize images, preload critical resources |
| 3 | INP | Reduce JavaScript, keep event handlers lean |
| 4 | CLS | Set dimensions, preload fonts |
And: optimize at the template level, not URL by URL. A fix in the base layout solves the problem on every page that uses that template.
Optimizing LCP: The Three Strongest Levers
The hero image is almost always the LCP candidate. Three actions consistently save 1–2 seconds combined across my projects — but only once it is clear where the time actually goes.
First Find Out Which Phase Is Too Long
An LCP of 4 seconds does not yet tell you what is wrong. Google splits it into four phases, and the right fix depends on which one dominates:
| Phase | What happens there | If this is the long one |
|---|---|---|
| Time to First Byte | Request until the first byte of the HTML response | Hosting, caching, CDN — the image is innocent |
| Resource Load Delay | Time until the browser even requests the LCP image | The image is discovered too late: preload, fetchpriority, no loading="lazy", no CSS background image |
| Resource Load Duration | The download of the image itself | Format and dimensions: WebP/AVIF, srcset, a smaller file |
| Element Render Delay | The image has arrived but is not painted yet | Render-blocking CSS or JS, a web font holding back the text |
On a typical WordPress site the time sits in TTFB and load delay almost every time — not in the file size. Compress the image only, and you win a few hundred milliseconds and wonder why the number will not move.
You can read the breakdown in PageSpeed Insights in the section on the LCP element; in Chrome DevTools the Performance panel shows it.
1. Image Format and Size
A 5 MB hero image that could work as a 200 KB WebP is the most common LCP killer. The fix:
<img
  src="/hero.webp"
  alt="Description"
  width="1200"
  height="630"
  fetchpriority="high"
  loading="eager"
/>- WebP/AVIF instead of PNG/JPG — 30–50% smaller at the same quality
fetchpriority="high"signals to the browser: this image takes priority- Explicit
width/height— prevents layout shifts and allows the browser to reserve space
2. Eliminating Render-Blocking Resources
Every CSS or JS file in the <head> without async or defer blocks rendering. Modern frameworks like Astro handle this automatically — for WordPress sites with 15+ plugins, it’s worth checking the Network tab.
Quick test: open Chrome DevTools → Network → filter by “Render-blocking”. Everything marked red there is delaying your LCP.
3. Bringing Server Response Time (TTFB) Under 200 ms
A CDN like Cloudflare can push TTFB below 50 ms — the simplest and most impactful lever for static websites. For WordPress sites: server-side caching (WP Super Cache, WP Rocket) delivers similar results.
Improving INP: The Problem Is JavaScript
INP is the most commonly failed Core Web Vital metric: 43% of all websites exceed the 200 ms threshold. The reason: too much JavaScript on the main thread.
The Three Phases of an Interaction
INP breaks down into three parts as well, and again the dominant part decides the fix:
| Phase | What happens there | Typical cause |
|---|---|---|
| Input delay | The tap has happened, your handler has not started | The main thread is busy with something else — usually third-party scripts or a long task during load |
| Processing duration | Your event handlers run | Too much work in the handler: reading and writing layout in turns, large lists, synchronous rendering |
| Presentation delay | Handler done, the browser has not painted yet | A large DOM tree, expensive CSS effects, costly rendering |
This is why the advice “use less JavaScript” so often goes nowhere: if input delay dominates, a leaner handler changes nothing — what has to go is the work blocking the thread before the click.
Which interaction it hits is revealed by the attribution build of the same library:
import { onINP } from "web-vitals/attribution";

onINP(({ value, attribution }) => {
  console.log(value, {
    element: attribution.interactionTarget,   // CSS selector of the element
    type: attribution.interactionType,        // "pointer" | "keyboard"
    inputDelay: attribution.inputDelay,
    processing: attribution.processingDuration,
    presentation: attribution.presentationDelay,
  });
});
The value of interactionTarget is where the search starts — instead of guessing somewhere in the bundle.
Three actions that make the biggest difference:
Audit third-party scripts. Analytics, chat widgets, tag managers, and social media embeds are the usual suspects. In a recent project, removing an unused Intercom widget dropped INP from 380 ms to 120 ms — a single line of code.
Keep event handlers lean. Heavy computations have no place in click handlers. Offload compute-intensive work to requestIdleCallback or Web Workers.
content-visibility: auto on long pages. This CSS property tells the browser: only render what’s visible. On pages with 20+ sections, it can cut INP in half.
.section-below-fold {
  content-visibility: auto;
  contain-intrinsic-size: 0 500px;
}
Avoiding CLS: Usually Easy to Fix
CLS issues are the easiest to resolve — because the causes are almost always the same:
Images and videos without dimensions. The element loads, everything shifts. Fix: always set width and height in HTML. The browser reserves the space before the image arrives.
Web fonts without a fallback strategy. Text jumps when the custom font replaces the system font. Fix:
@font-face {
  font-family: "Inter";
  font-display: swap;
  src: url("/fonts/inter.woff2") format("woff2");
}
Even better: font-display: optional — the custom font is only shown if it loads in time. No jump, no flash.
Dynamically injected content. Cookie banners, sticky headers, and ad banners are classic CLS culprits. Reserve the space in advance with a fixed height, or use position: fixed / position: sticky to avoid disrupting the document flow.
The Lever Almost Everyone Misses: bfcache
When a visitor navigates back, Chrome can restore the previous page completely from the back/forward cache — JavaScript state included, in a few milliseconds. For that navigation, LCP and CLS are effectively zero. Many sites disqualify themselves from it, almost always by accident:
- an
unloadevent listener (deprecated, and a reliable bfcache blocker — usepagehide) Cache-Control: no-storeon the HTML document- an open WebSocket connection or IndexedDB transaction at the wrong moment
How to check: Chrome DevTools → Application → Back/forward cache → “Test back/forward cache”. Chrome names the blocking reason in plain language, including where it comes from.
Measuring: Three Tools Are Enough
To get started, you need no more than this:
- PageSpeed Insights — shows field data (real users) and lab data in a single report. The field data section at the top is what Google actually uses for rankings.
- Chrome DevTools → Performance — for frame-precise analysis of individual interactions. Essential for INP debugging, and the only place where you can actually pin a long task to a function.
web-vitalsin your own frontend — for pages with too little traffic for the Chrome UX Report, or when you do not want to watch a change for six weeks.
Real-World Example
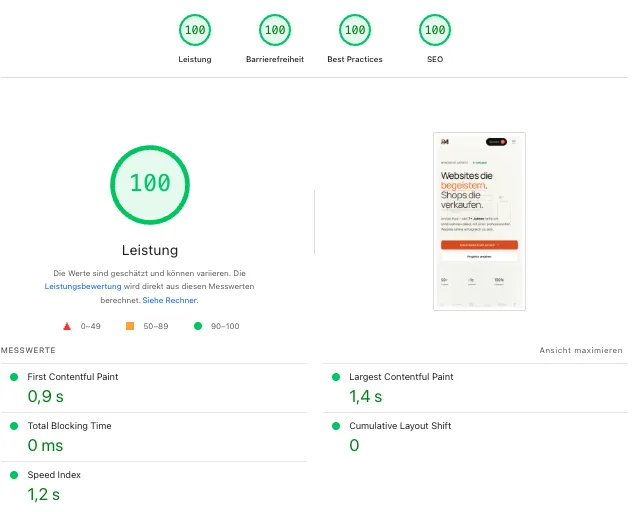
4× 100 in PageSpeed Insights
Here’s what the results of the actions in this article look like in practice — a current report from paulmill.com.
Static delivery via Cloudflare, optimized image formats, no render-blocking JavaScript, and explicit dimensions on all media elements.
- LCP 1.4 s
- CLS 0
- TBT 0 ms
- Speed Index 1.2 s
Optimize for real users, not Lighthouse scores. A score of 95 with poor field data does nothing for your ranking. Field data from the Chrome UX Report is more meaningful than any lab test.
Frequently Asked Questions About Core Web Vitals
Are good Core Web Vitals enough for a top ranking on their own?
No. Content relevance and domain authority carry more weight. Google’s John Mueller has confirmed this multiple times: “Relevance is still by far much more important.” But when content is comparable, Core Web Vitals determine whether you land at position 3 vs. position 8 — and that’s a massive difference in traffic.
How quickly do improvements take effect?
Field data in the Chrome UX Report is rolled over 28 days. After a fix, it takes 4–6 weeks before Google sees the improvement. Don’t panic if nothing changes after two weeks.
Do Core Web Vitals apply to desktop too?
Yes, but since 2024 Google primarily uses mobile field data as a ranking signal — including for desktop results. Optimize for mobile first.
PageSpeed Insights shows no field data. Now what?
Then your page has too few Chrome visitors for the Chrome UX Report — for a small business website that is normal, not a fault. Check whether at least origin-level data is shown for the domain, use the Lighthouse report for diagnosis, and measure your own visitors with web-vitals in parallel. Missing data is no ranking disadvantage in itself: Google falls back to origin-level data.
Origin data or URL data — which one counts?
If there is enough data for the individual URL, that is what gets used; otherwise Google falls back to the values for the whole origin. The practical consequence: on a small site, one slow, heavily visited page drags the assessment of every other page down with it. It is also why optimizing the template pays off more than optimizing a single URL.
My INP is 250 ms. Do I need to act right away?
250 ms is “needs improvement”, not “poor” — no emergency, but a signal. First find out which of the three phases drives the number. If input delay dominates, third-party scripts are the usual cause, and then the question is less technical than commercial: what is the chat widget worth that delays every first click by 200 ms?
The Bottom Line
Core Web Vitals are neither a mystery nor a full-time job. With the right image formats, lean JavaScript, and clean layout handling, green scores are achievable in most cases within a few hours.
The short formula: load fast (LCP ≤ 2.5 s), respond fast (INP ≤ 200 ms), don’t shift (CLS ≤ 0.1). If you want to know what a faster website could mean for your business, get in touch for a quick performance review.